Note
Click here to download the full example code
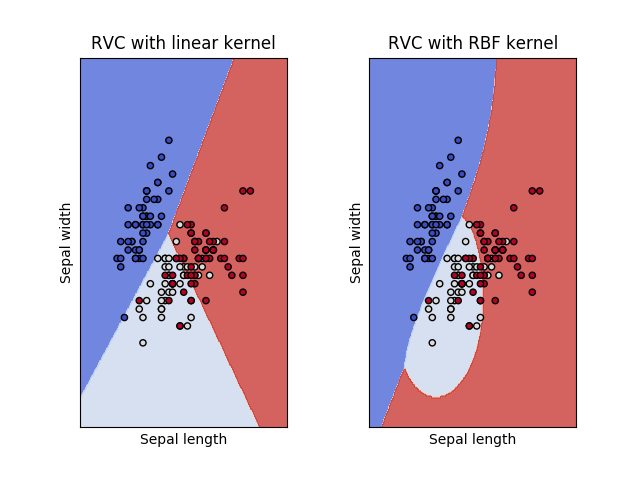
Example of a Multiple Layer Classifier using the Iris Dataset
Based on https://scikit-learn.org/stable/auto_examples/svm/plot_iris_svc.html
Out:
/home/docs/checkouts/readthedocs.org/user_builds/sklearn-rvm/envs/latest/lib/python3.7/site-packages/sklearn_rvm/em_rvm.py:679: FutureWarning: The default value of gamma will change from 'auto' to 'scale' in version 0.22 to account better for unscaled features. Set gamma explicitly to 'auto' or 'scale' to avoid this warning.
  "avoid this warning.", FutureWarning)
print(__doc__)

import matplotlib.pyplot as plt
import numpy as np
from sklearn import datasets
from sklearn_rvm import EMRVC


def make_meshgrid(x, y, h=.02):
    """Create a mesh of points to plot in

    Parameters
    ----------
    x: data to base x-axis meshgrid on
    y: data to base y-axis meshgrid on
    h: stepsize for meshgrid, optional

    Returns
    -------
    xx, yy : ndarray
    """
    x_min, x_max = x.min() - 1, x.max() + 1
    y_min, y_max = y.min() - 1, y.max() + 1
    xx, yy = np.meshgrid(np.arange(x_min, x_max, h),
                         np.arange(y_min, y_max, h))
    return xx, yy


def plot_contours(ax, clf, xx, yy, **params):
    """Plot the decision boundaries for a classifier.

    Parameters
    ----------
    ax: matplotlib axes object
    clf: a classifier
    xx: meshgrid ndarray
    yy: meshgrid ndarray
    params: dictionary of params to pass to contourf, optional
    """
    #Z = clf.predict_proba(np.c_[xx.ravel(), yy.ravel()])[:, 1]
    Z = clf.predict(np.c_[xx.ravel(), yy.ravel()])
    Z = Z.reshape(xx.shape)
    out = ax.contourf(xx, yy, Z, **params)
    return out

# import some data to play with
iris = datasets.load_iris()
# Take the first two features.
X = iris.data[:, :2]
y = iris.target


models = (EMRVC(kernel='linear'),
          EMRVC(kernel='rbf'),
          EMRVC(kernel='sigmoid'))
models = (clf.fit(X, y) for clf in models)

# title for the plots
titles = ('RVC with linear kernel',
          'RVC with RBF kernel')

# Set-up 2x2 grid for plotting.
fig, sub = plt.subplots(1, 2)

plt.subplots_adjust(wspace=0.4, hspace=0.4)
X0, X1 = X[:, 0], X[:, 1]
xx, yy = make_meshgrid(X0, X1)

for clf, title, ax in zip(models, titles, sub.flatten()):
    plot_contours(ax, clf, xx, yy,
                  cmap=plt.cm.coolwarm, alpha=0.8)
    ax.scatter(X0, X1, c=y, cmap=plt.cm.coolwarm, s=20, edgecolors='k')
    #ax.scatter(clf.relevance_vectors_[:, 0], clf.relevance_vectors_[:, 1], s=100, facecolor="none", edgecolor="g")
    #ax.colorbar()
    ax.set_xlim(xx.min(), xx.max())
    ax.set_ylim(yy.min(), yy.max())
    ax.set_xlabel('Sepal length')
    ax.set_ylabel('Sepal width')
    ax.set_xticks(())
    ax.set_yticks(())
    ax.set_title(title)

plt.show()
Total running time of the script: ( 1 minutes 38.313 seconds)